


Education Abroad Statistics
CSU Education Abroad Participation Data
CSU takes pride in creating opportunities for more students to have an education abroad experience. With such an experience, our future leaders are brought together in authentic and often culturally immersive learning environments to reflect on our changing world and how they can make positive impacts on our shared future.
In order to track successes, it is important to benchmark where CSU started and who we are serving. Then, we can address the barriers to an education abroad and find opportunities for more majors and diverse identities to participate. The following data visuals are intended to inform and challenge the CSU community to be as globally engaged as we can be.
Check out our various stats below
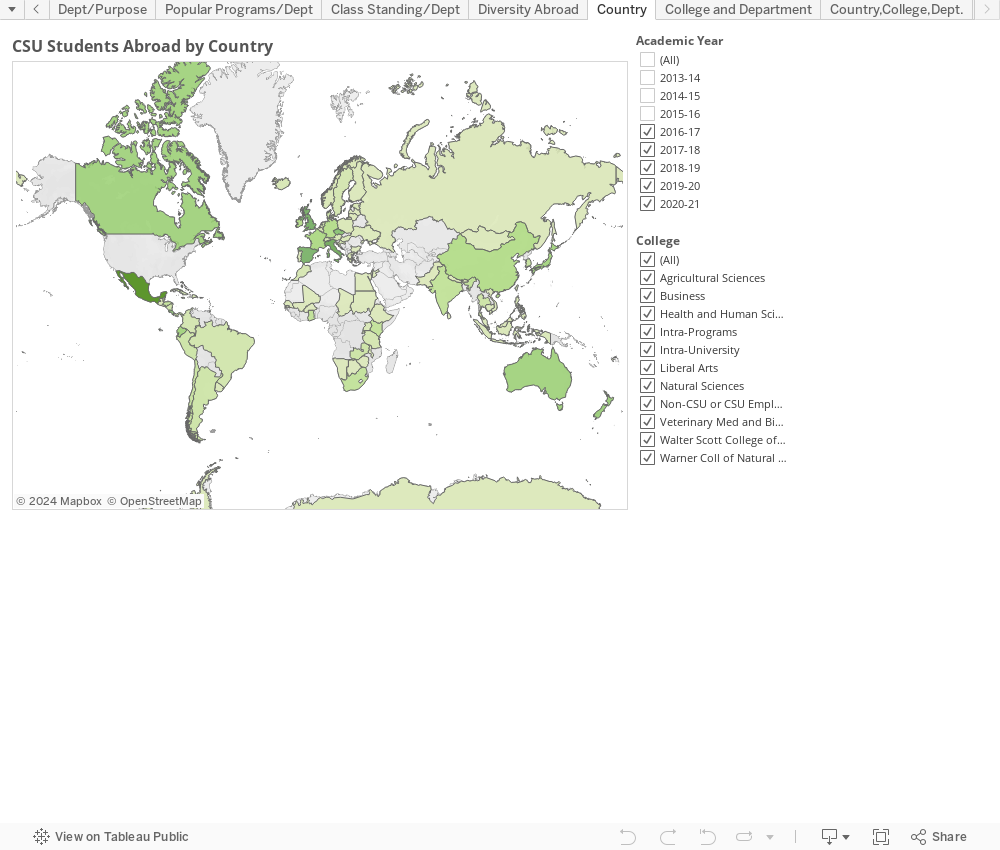
Education Abroad by Country
Overall CSU Education Abroad Participation Rates
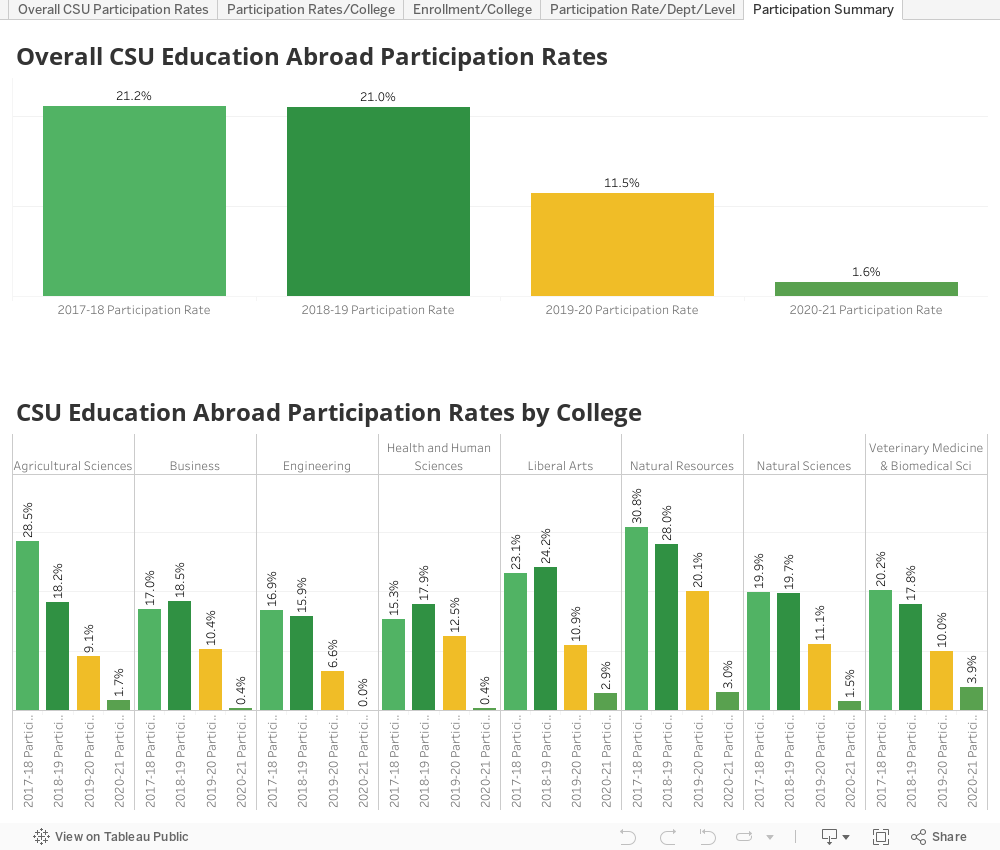
Participation rates are calculated based on the number of CSU students abroad in a given year divided by the number of students graduating that year. CSU tracks and includes all study, research, internships, service learning, or other international educational experiences, which may be for-credit or not-for-credit. Annual updates are posted each October for the previous academic year. Note: COVID-19 travel restrictions greatly impacted 2020 and 2021 participation rates because nearly all learning abroad needed to be cancelled or postponed.
CSU Interactive Enrollment by College and Department
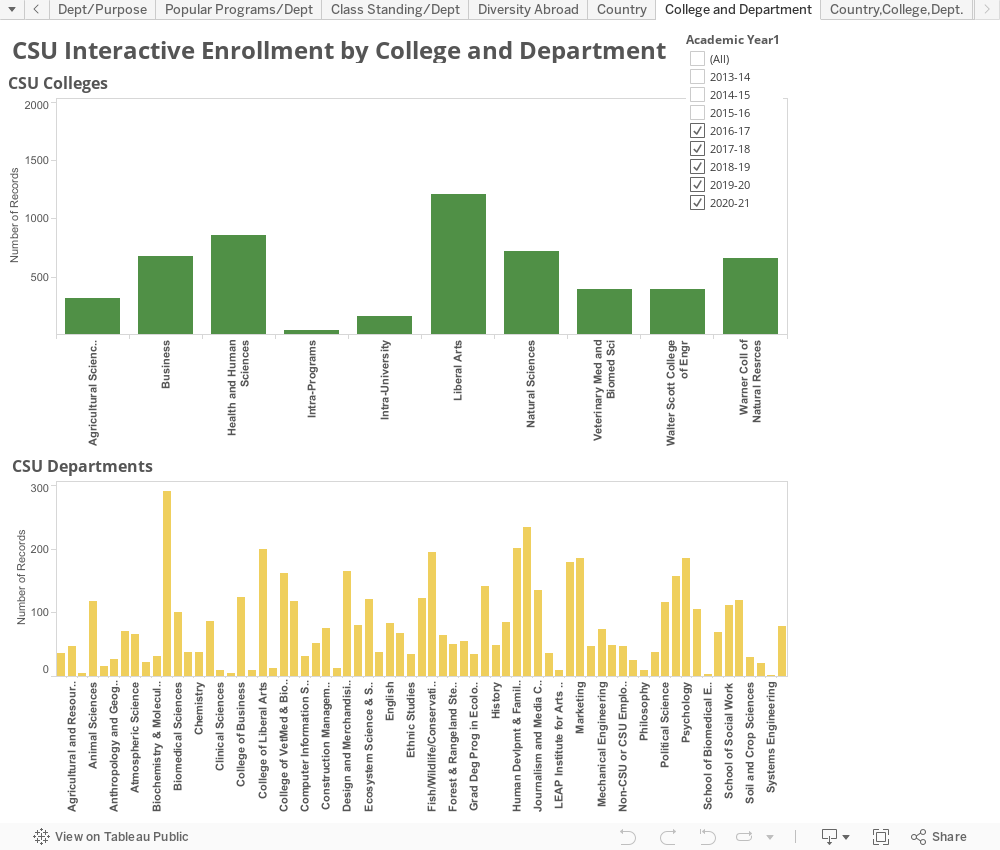
These charts are interactive. If you would like to drill down into individual college, department, or country enrollment data, just click on the associated bar or country. Likewise, the legends on top provide the opportunity to look at enrollment in individual years or student levels.
Diversity Abroad
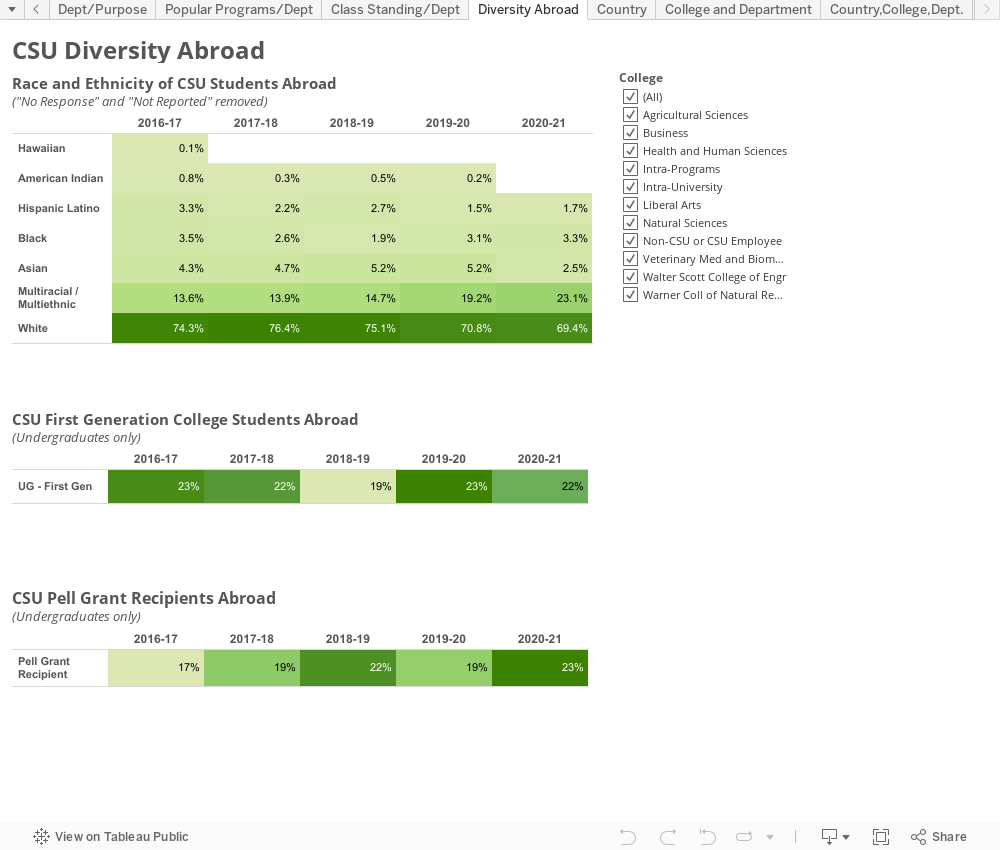
As CSU aimed to reach its IIE Generation Study Abroad goal of sending 1,700 students abroad in 2020, we recognized the financial, academic, and/or social barriers that many students face. We are continually trying to reduce these barriers. Thanks to the investment of many campus and community stakeholders the enrollments are generally moving in the right direction. CSU strives to have at least equal representation of all student identity groups abroad reflect our diverse representation on campus. Above represents a few groups CSU is closely following because of the disproportionate benefits an education abroad can have on their graduation potential.
Special notes:
- Twenty-five percent of CSU undergraduate students are first generation college students, who are the first in their families to complete a bachelor’s degree.
- Twenty-two percent of CSU undergraduate students are Pell Grant recipients, which means that their families can provide under $6,000 per year towards their educational costs, even though the estimated cost of attendance is much higher.
- Twenty-five percent of CSU students self-report that they are racially and ethnically diverse.
Consider giving
If you are interested in creating more student access for education abroad experiences, please consider giving here.